Unemployment, An Update

Published Friday, May 1, 2020 as an update to the post Visualizing the Unprecedented Speed and Size of Unemployment.

Unemployment numbers from the last two weeks are in. According to the department of labor, as reported by CBS, the week of April 18th saw 4.4 million claims, and the week of April 25th saw 3.8 million.

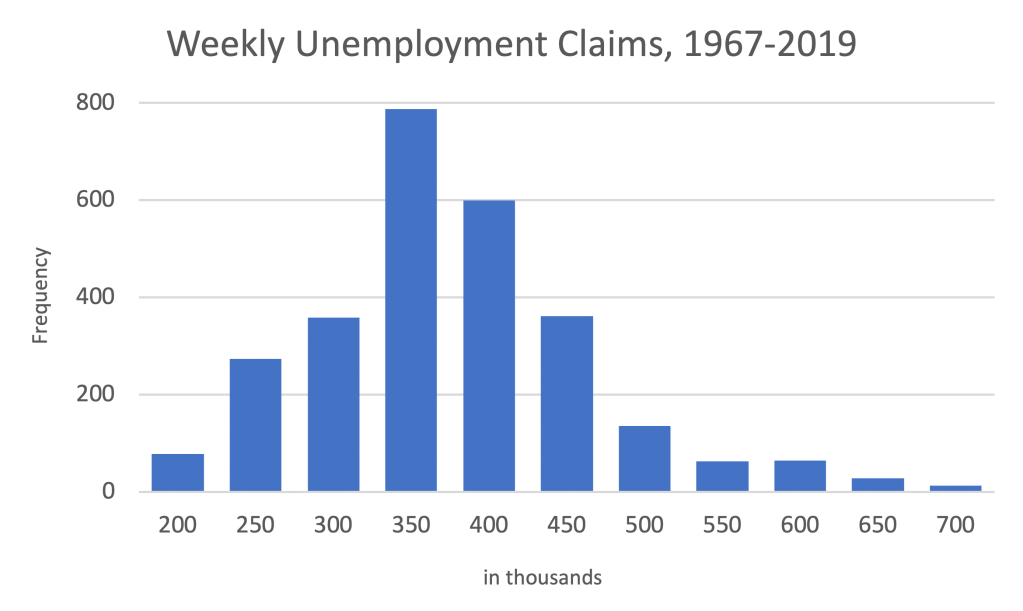
I went back to the data from the previous post and reran the numbers. To get a single-number comparison, I reran the numbers in six-week increments. This histogram shows unemployment from every six-week period from 1967 to the end of 2019.

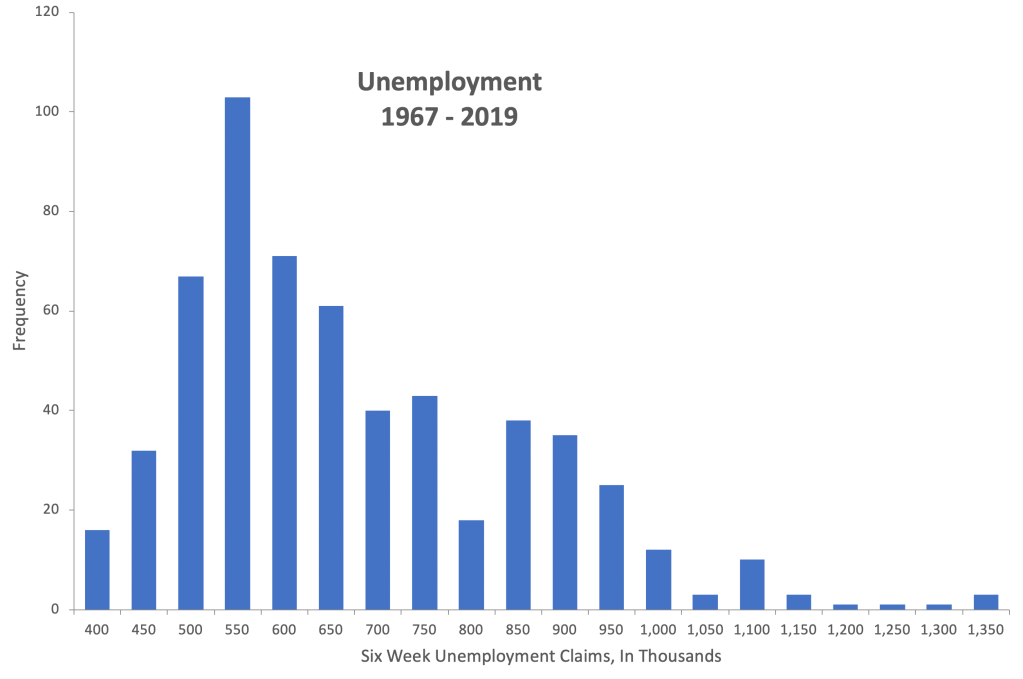
The minimum is about 400,000 claims, the maximum 1,350,000 claims, and the mean 649,000 claims per six-week period. The standard deviation in the distribution is 180,000. Add in the last six weeks, which have seen 30,307,000 file for unemployment, and the histogram looks like this:

The data point from the last six weeks is so far above the rest of the distribution it’s nearly invisible (sorry for making you squint), so I painted it in.

That data point of the 30.3 million unemployed sits 164.3 standard deviations above the mean. And that’s not a typo. One hundred and sixty four point three standard deviations above the mean.

And if there were a line of the unemployed, everyone standing six feet apart, the line would be 34,439 miles long. It would stretch from Boston, to Seattle, to San Diego, to Miami, and back to Boston four times.

Economists anticipate three potential ways to recover from the current economic crisis, represented by the letters V, U, and L. The first would be a fast return to where we were economically before January. A U-shaped recovery is more gradual. An L-shaped recovery would be a slow return to economic normal.

I have no crystal ball, but given the unemployment numbers we’ve seen in the last six weeks, I anticipate something between a stretched U and an L-shaped recovery.

Visualizing the Unprecedented Speed and Size of Unemployment

As of the latest report from the New York Times, 22,034,000 Americans filed for unemployment benefits in the last four weeks. That’s a massive number of people–so massize that human minds struggle to comprehend just how large and how fast those claims are being filed. We can compare it to the Great Recession, where it took two years for 8 million Americans to lose their jobs. Translating data from numbers to a visual might help illustrate just how fast and how large the the unprecedented unemployment numbers are. 

Unprecedented Speed

The rate at which Americans are filing for unemployment is literally off the chart. First, let’s take a look at unemployment claims per week going back to January 1967 (when the Department of Labor started keeping track of weekly claims) up until December 2019. (Source data downloadable here.)

The average claims filed per week falls somewhere around 350,000, with a minimum of about 200,000, and a maximum of approximately 700,000.

Where do the last four weeks fall on this histogram?

To fit data from the last four weeks into the histogram, we have to smash the previous 53 years of data to the far left. It’s visually clear that recent unemployment data is far above anything previously, but how far above, precisely?

Statisticians use a measure called standard deviation (represented with the Greek letter sigma) to measure how far away from the mean a particular observation is. When speaking of standard deviations, we’re usually dealing with single digits. In a standard normal distribution, 99.7% of all data points fall within three standard deviations below and three standard deviations above the mean. Six Sigma, a technique of improving processes until they’re 99.99966% efficient, is so named because the idea six standard deviations is extreme. 

Using standard deviations, how abnormal are the last four weeks of unemployment claims? The week ending March 21, which saw 2.92 million applications for unemployment, was 29 standard deviations above the mean. The week ending April 4, which saw 6.21 million applications, was 66 standard deviations above the mean. The United States has never before seen unemployment at this speed. 

Size 

To comprehend the enormity of unemployment claims, let’s translate 22,034,000 into a map. What if we took everyone who’s filed for unemployment and lined them up, in an appropriate-for-social-distancing line, everyone six feet apart, starting in Boston? How long do you think that line would be? 

The line of unemployed adults would stretch from Boston to Seattle.

Then down to San Diego.

Then over to Miami.

And back up to Boston…

THREE TIMES!

(Technically, you would finish the line 300 miles short of Boston on the last lap, BUT STILL). The line would be 25,038 miles long. 

If you drove with your hand out the driver’s side window, at 75 miles per hour, high-fiving everyone in that line (something I don’t recommend for several reasons), it would take two full weeks to get to the end of the line. That’s two weeks with no stopping for bathroom breaks, no stopping for food, and no stopping for gas. 

Economic Momentum

In physics, the effect one moving object will have on another is calculated using momentum, defined by multiply mass (size) times velocity (speed). The two visualizations above demonstrate the size and speed of the recent shock to USA employment. Given the economic momentum of the last four weeks, I think it’s going to take some time for the country’s economy to recover.

Update

I’ve rerun the numbers with two more weeks of unemployment claims, comparing six week intervals, posted here.

Data Is The New Soil

How do you change a mind? This is a massive, massive question I’ve been pondering, and the answer seeps into nearly every aspect of human interaction, from marketing and organizational change management to politics and disaster response.

Part of the answer is that changing minds requires telling stories with effective data. This 2012 Ted Talk on data visualization walks through some of the concepts of producing effective data. The first three minutes are key. The rest is brilliant.

Data is the new soil.

Communication and Collaboration Lessons from “My Semester with the Snowflakes”

Favorite lessons and excerpts from an article by James Hatch, a 52-year old military veteran who enrolled in Yale to get his undergraduate degree, called “My Semester with the Snowflakes.”

Safe Space

“I come from a place where when I hear that term, I roll my eyes into the back of my vacant skull and laugh from the bottom of my potbelly. This time, I was literally in shock. It hit me that what I thought a “safe space” meant, was not accurate. This young woman, the one who used the phrase, isn’t scared of anything. She is a life-force of goodness and strength. She doesn’t need anyone to provide a comfortable environment for her. What she meant by “safe space” was that she was happy to be in an environment where difficult subjects can be discussed openly, without the risk of disrespect or harsh judgment.” (Emphasis in original)

Psychological safety is required for effective interpersonal dialogue and for effective teamwork. Frequently, people don’t feel safe to share their ideas or their experiences. They’re afraid of retribution: being told their idea is dumb, or having their experiences discounted.

Creating safe space doesn’t mean ensuring people are safe from complexity and difficult topics. Rather, it means creating an environment where people feel safe to discuss difficult topics.

It isn’t a freedom from conflict, but the freedom to engage in productive conflict.

“There HAS to be a place where people can assault ideas openly and discuss them vigorously and respectfully in order to irmpove the state of humanity.”

Snowflakes

In my opinion, the real snowflakes are the people who are afraid of that situation. The poor souls who never take the opportunity to discuss ideas in a group of people who will very likely respectfully disagree with them. I challenge any of you hyper-opinionated zealots out there to actually sit down with a group of people who disagree with you and be open to having your mind changed. I’m not talking about submitting your deeply held beliefs to your twitter/facebook/instagram feeds for agreement from those who “follow” you. That unreal “safe space” where the accountability for one’s words is essentially null. I have sure had my mind changed here at Yale. To me there is no dishonor in being wrong and learning. There is dishonor in willful ignorance and there is dishonor in disrespect.

When was the last time you changed your mind about someone or about something? How comfortable are you addressing someone’s sincere and well-thought disagreement with your mindset? When was the last time you disagreed with someone in such a way that convinced them? That they adopted your mindset?

It doesn’t matter how much we know if we have closed our minds off to adapting to new information.

Why Does Hugh Care?

I have been asked why I focus so much on “tone” (a bit of a misnomer on this topic, in my opinion. “Tactics” is a better descriptor). Why does it matter how people interact?

Three reasons. I care because how we choose to communicate reveals what is under the surface. The polarization in our political and religious discourse reveals a deep and powerfuil undercurrents of disrespect, enmity, and prejudice. Too often, what we think of our political, religious, and intellectual opponents is based on false assumptions. We haven’t put in the work to counter the inherent human idea that people who disagree with us must, by necessity, be morons, because, well, we’re awesome.

Second, how we communicate determines the outcomes of our communications. It reveals our intentions. When we interact with the world, are we hoping that we can learn something from the world around us? Are we hoping that we can teach the world something of value? Or are we merely hoping to score internet points with strangers who already agree with us, and crank up the volume inside of the echo chamber?

Third, I care because I am convinced that the solution to the world’s problems and injustices is on the other side of effective collaboration. Hatch talks of building bridges between people who disagree and coming together. Fixing the big problems of our time–poverty, health, inequality, racism, disconnection–requires that groups with different ideologies and viewpoints work together.

It matters because because “we need everyone who gives a damn about this… to contribute and make it succeed.”